STEP 2 – SCIENTIFIC ANALYSIS AND FOCUS ON PHENOMENON OF RESILIENCE
Understanding the drop out phenomenon starting from the relationship among young people, coaches, schools, families
General overview of the results – PYSD subscales analysis
PYSD mission is to create a European standard methodology to prevent sport dropout phenomenon, through the analysis of the general rate of resilience of young athletes and besides the relationship between young athletes and family, and young athlete and coach.
Below the interpretation data of the scales investigated on a sample of Bulgarian, Italian, Spanish and Serbian young people, who practice different sports.
1. Achievement at The Student Resilience Scale (SRS)
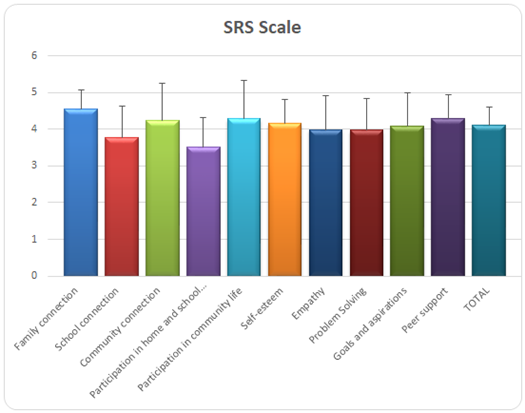
The results of the research on the degree of resilience (Table 1 and Fig. 1) obtained on the complete sample, using the SRS questionnaire (Lereya et al, 2016) showed that the total score of the examined children is high (TOTAL = 4.12, on a scale of 1-5). Considering the resilience as a qualitative attitude of young athletes, potentially useful to affect the prevention of dropout phenomenon, the results of research show some interesting subscales for resilience:
- Family connection
- Participation in community life
- Peer support
- Community connection
- Self esteem
- Goals and aspiration peer supports
It can be noticed that Family connection is the most pronounced (with the smallest deviation from the average value, SD = 0.54) and that it differs significantly in relation to other assessed indicators (p ˂ 0.0001). In addition, significant differences on the same p level were also recorded between most other indicators among which Community connection, Participation in community life, Pear support and Self-esteem, also showed high scores, with slightly higher SD.
Table 1. Total sample achievement (mean ± SD) at SRS by subscales and general score (TOTAL).
| FC | SC | CC | PH | PC | SE | EM | PS | GA | PST | TOTAL | |
| Mean | 4.54 | 3.78 | 4.24 | 3.51 | 4.29 | 4.15 | 3.99 | 3.97 | 4.08 | 4.29 | 4.12 |
| SD | 0.54 | 0.86 | 0.82 | 0.81 | 1.02 | 0.66 | 0.92 | 0.87 | 0.91 | 0.65 | 0.47 |
SD – standard deviation, FC – Family connection, SC – School connection, CC – Community connection, PH – Participation in home and school life, PC – Participation in community life, SE – Self-esteem, EM – Empathy, PS – Problem Solving, GA – Goals and aspirations, PST – Peer support, TOTAL – general score.
The lowest scores were obtained for the indicators Participation in home and school life and School connection. The result seems to bring out a youth reality where family and school institutions are still fundamental for individual well-being but where young people sometimes fail to play a proactive and conscious role.

Figure 1: Total sample achievement (mean ± SD) at SRS by subscales and general score (TOTAL)
2. Achievement at The Parent Involvement in Sport Questionnaire (PISQ)
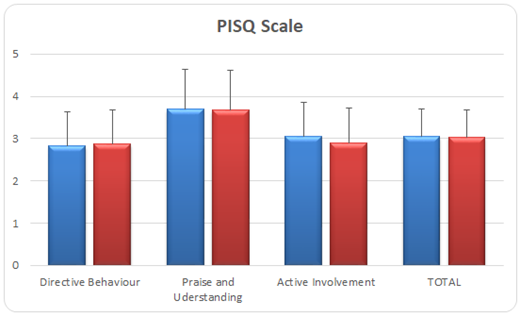
The involvement of parents (guardians) in sports activities of their children was assessed by the PISQ (Lee & MacLean, 1997). The results of the research (Table 2 and Fig. 2) showed that parental involvement (observed in the whole sample) was at the moderate level (TOTAL = 3.03 for Father and 3.03 for Mother, on a scale from 1 to 5). Observed by subscales, the indicator Prise and understanding was rated with highest score, which indicate that a large percentage of tested children receive understanding form their parents and a reward for their sport effort. This is also in line with the lower scores on the subscale Direct behaviour, which indicate that parents generally do not have a commanding attitude towards their children in relation to their sports engagement.
Table 1: Total sample achievement (mean ± SD) at PRSQ by subscales and general score (TOTAL).
| Directive Behaviour | Praise and Uderstanding | Active Involvement | TOTAL | |
| Father | 2.82 | 3.69 | 3.04 | 3.04 |
| 0.81 | 0.95 | 0.81 | 0.65 | |
| Mather | 2.87 | 3.67 | 2.89 | 3.03 |
| 0.81 | 0.94 | 0.83 | 0.65 |
Although, apparently, there are no differences between father and mother involvement, statistical data processing revealed the presence of differences at the level of p ˂ 0.001, in favour of the father. Observed by subscales, fathers showed less directive behaviour than mothers, gave more support and understanding (Prise and understanding) and were more actively involved in their children’s sports activities, compared to mothers.
This aspect stimulates a reflection, considering the different roles played by mothers and fathers and in general from men and women in sport. As reported in several European researches of European institution for gender equality (EIGE) “the sport is traditionally associated with ‘masculine’ characteristics, such as physical strength and resilience, speed and a highly competitive, sometimes confrontational spirit. In many societies, women who engage in sports are perceived as ‘masculine’, while men who are not interested in sports are considered ‘unmanly’.”[1]
[1] Cfr: https://eige.europa.eu/gender-mainstreaming/policy-areas/sport

Figure 2: Total sample achievement (mean ± SD) at PISQ by subscales and general score (TOTAL).
It should be noted that the previously given interpretation and analysis is based on average values, but when interpreting the obtained results, high values of standard deviations, which indicate a high variability, should be also taken into account. Transferred to practice, this means that there are parents who are very involved in their children’s sports life, provide them with support and understanding, with less directive behaviour, while on the other hand there are those parents who do not get much involved, have a commanding attitude and do not give enough support and understanding to their children.
3. Achievement at The Coach-Athlete Relationship Questionnaire (CART-Q)
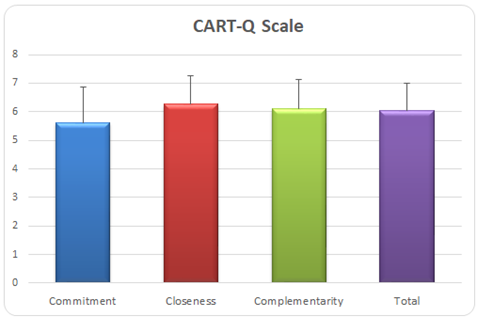
The coach-athlete relationship was assessed by the CART-Q (Jowett & Meek, 2002), using only the athlete version of questionnaire. The results showed (Table 3 and Fig.3) that the general athletes’ satisfaction of the relationship with the coach is at a high level (TOTAL = 6.03, on a scale of 1-7). Analysed the results by subscales (Commitment, Closeness and Complementarity) it is shown that there is a significant difference (p ˂ 0.0001), between all three indicators: closeness to the coach is the most valued, while commitment to the coach is the least. Just like the assessment of other two variables (resilience and involvement of parents in children’s sports activities), there is a high variability of results of the variable coach-athlete relationship, with it being most pronounced in the Commitment indicator. Such findings indicate that there is a large deviation from the average result, and that not all children show approximately the same satisfaction with their relationship with the coach, and especially pronounced in terms of commitment.
Table 2: Total sample achievement (mean ± SD) at CART-Q by subscales and general score (TOTAL).
| Commitment | Closeness | Complementarity | TOTAL | |
| Mean | 5.63 | 6.27 | 6.10 | 6.03 |
| SD | 1.23 | 1.01 | 1.02 | 0.97 |
These results seems to identify a crucial point and suggest that a good relationship and an emotional bond with coach (closeness) does not always translate into empowerment, i.e. effective engagement of the children with the coach (commitment). On the other hand, a high level of the standard deviation seems to confirm a relevant dispersion of the answers over different young athlete’s perception. A standard approach valid to different context should pay attention to the complex and different behaviour implemented in the athlete-coach relationship.

Figure 3: Total sample achievement (mean ± SD) at CART-Q by subscales and general score (TOTAL).
NEXT STEPS
Starting from these results the next steps of the project will consists of:
- Extending the analysis carried out for each partner country at the level of the partnership area in order to obtain input for an overall European analysis;
- Identifying a set of concrete actions to improve the level of resilience of young people in each of the dimensions analyzed in the research;
- Testing the actions on a sample of young people in the different partner countries;
- Analyzing the results of the test in order to share educational patterns in which children, parents, coaches and sports clubs can dialogue and take an active part in order to optimize the choice of instruments and objectives.
References
Jowett, S & Ntoumanis, N (2004). The Coach-Athlete Relationship Questionnarie (CART-Q): development and initial validation. Scandinavian Journal of Medicine & Science in Sports, 14(4):245-57.
Lee, M & MacLean, S (1997). Sources of Parental Pressure Among Age Group Swimmers. Europian Journal of Physical Education, 2:2, 167-177.
Lereya et al. (2016). The student resilience survey: psychometric validation and associations with mental health. Child Adolesc Psychiatry Ment Health, 10:44.
Download PYSD – Prevention model – White Paper ![]()
Download_PSYD – REPORT_Preliminary Data![]()


